Creating Data Apps using Pure Python
Building Custom Apps using Streamlit
- Track: Python devroom
- Room: D.python
- Day: Sunday
- Start: 16:30
- End: 17:00
- Video with Q&A: D.python
- Video only: D.python
- Chat: Join the conversation!

Have you always wanted a flexible & interactive visualization that is easy for others to work with without handling all the Javascript libraries? Or do you want to build a user interface for your Machine Learning Model? This talk has you covered with building data apps in Python using Streamlit with examples of a Travel Visualization App using Google Maps Data & an UI for the ImageNet Model.
In this talk, I showcase couple of different use cases where you can build your data focussed applications using Streamlit, an open source library in pure Python.
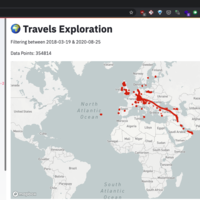
In the first use case, I cover how you can build interactive dashboards using different Streamlit components. These dashboards can be easily deployed & the consumers can easily work with the interactive dashboards without worrying about all the dependencies that need to be installed to run the Jupyter notebooks. In the showcase, I will go over how you can build a dashboard of your historical travels using Google Maps Location History including some memories from them from Flickr.
In the second showcase, I will describe how users can create a quick interface for their machine learning model using Streamlit. These interfaces are much faster to develop than building a custom frontend interface for machine learning models with the help of Javascript libraries. In the demo, I showcase how I built an UI for the ImageNet Model.
The showcases will showcase how these data based web apps can be built using Python functions & Streamlit components.
Speakers
| Nithish Raghunandanan | |
| Matteo Bertucci |