Spatial data exploration in Jupyter notebooks
The power of interactive vizualizations with GeoPandas and HoloViews
- Track: Geospatial devroom
- Room: D.geospatial
- Day: Sunday
- Start: 15:30
- End: 16:05
- Video with Q&A: D.geospatial
- Video only: D.geospatial
- Chat: Join the conversation!
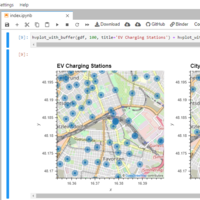
Recent developments in Python data visualization libraries (particularly HoloViews & GeoViews) enable data analysts and scientists to quickly and intuitively create interactive data visualizations. In this talk, we dive into examples of visualizing open government data from public web services (https://github.com/anitagraser/ogd-at-lab) as well as large movement datasets (https://github.com/anitagraser/movingpandas-examples).
Speakers
| Anita Graser |