data mountains - turn your data into mountains!
convert geospatial points into triangles scaled by data
- Track: Lightning Talks
- Room: H.2215 (Ferrer)
- Day: Saturday
- Start: 13:40
- End: 13:55
- Video only: h2215_ferrer
- Chat: Join the conversation!
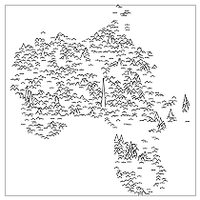
using a mountain metaphor instead of choropleth or cartogram visualisations has some use in showing similarities and differences between places. data mountains are a bit like bar charts on a map, but their mountainous shape makes the bars resemble topographic features!
using #nbdev to publish the package was fun because it makes it much easier for python teams to collaborate on jupyter notebooks in git as it cleans json metadata with a pre-commit hook that prevents merge conflicts, and it also makes it very convenient to document, test, and share code and packages on the web, pypi, and conda.
Speakers
| joe ldn |