Manylines
a graph web publication platform with storytelling features
- Track: Graph processing devroom
- Room: AW1.125
- Day: Saturday
- Start: 11:30
- End: 12:30

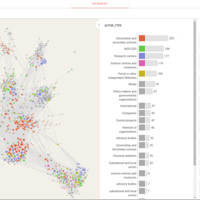
More and more people work with graphs nowadays, but it is not always easy to publish and share the graph interpretation on the web. Manylines is a web tool built at Sciences Po médialab to solve this issue. Some researchers and students use network visualizations to explore their data, but networks are not as clear as maps and sharing one’s interpretation is difficult. Manylines main innovation is to allow the user to explain and share a narrative about his network: an interactive story where each “slide” is a particular zoom, pan and filtering of the network, completed by a title and description, with fluid transitions like in Prezi.
Published as an open source prototype with the source code available on GitHub, Manylines is currently built around three screens: - The first screen allows applying the ForceAtlas2 layout to the network, in order to settle the “basemap”: the definitive positions of nodes and edges used to support further interpretations. - The second screen allows zooming and filtering the network to explore the data and “take snapshots” representing different insights. - The third screen allows composing narratives by building a series of snapshots, adding a title and short description for each step. The result is an interactive slideshow widget where the user's exploration of the network is guided step by step, revealing the key interpretation points one by one.
Manylines is a single webpage app built for HTML5 browsers. It makes an extensive use of the sigma.js library to deal with networks within the browser and it implements different features inspired from Gephi, the reference desktop graph viz platform. The WebGL visualization (with Canvas fallback) implemented by Sigma.js allows great performance for networks up to 1000 nodes on an average computer. To reach this level of performance, we optimized the javascript version of the ForceAtlas2 algorithm used by sigma.js. We ported it to use web workers and we optimized the Barnes-Hut quadtree approximation in this context by implementing it as an iterative and not recursive process. We made an extensive use of sigma.js' custom renderers and cameras to build dynamic graph thumbnails, snapshots and widgets. The server side stores the networks, snapshots and narrative data in a Couchbase database (which we discovered in FOSDEM 2014) accessed by a Node.js express REST API.
Speakers
| Paul Girard |