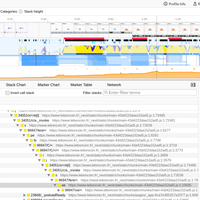
Using the Firefox Profiler for web performance analysis
Capture a performance profile. Analyze it. Share it. Make the web faster.
- Track: JavaScript devroom
- Room: UB5.230
- Day: Sunday
- Start: 16:30
- End: 16:55
- Video only: ub5230
- Chat: Join the conversation!

The Firefox Profiler was born as the Gecko Profiler, the internal tool that Firefox developers use to analyze and improve the performance of the Firefox browser.
Earlier this year, we replaced the Firefox Devtools' performance panel with this powerful tool, because we thought that Web Developers should also have access to the same data. While this newer tool provides a lot more information than what was previously available, it's also more complicated as a result. In this talk I'll explain and show the basics, so that you'll then be able to use the tool for your own profit.
At the end of the session, you'll understand what a profiler is, know how to capture a profile, and navigate in the Firefox Profiler UI like a pro. You'll be able to share performance profiles with your colleagues, report performance problems to open source libraries or Mozilla engineers. You'll know that in the performance world, measuring is always better than guessing.
The Firefox Profiler is a React-based open source web application that is open for contributions.
Speakers
| Julien Wajsberg |